Measurements may be influenced by the equipment used to make them or may be influenced by the process of making the measurements. The Measurement System includes the equipment and the process used in making the measurements. Therefore, we should perform a Measurement System Analysis (MSA) / Measurement System Evaluation (MSE) on a periodic basis (worst case it should be performed annually). In conjunction with an MSA / MSE we should capture, characterize, and analyze a sample set of manufacturing test data on a recurring basis, based on product volume, to ensure the continuing health of the product, process, and system. This ensures the product, process, and system remains in control during process changes, engineering change implementation, part changes, etc. throughout the product life cycle.
“We don’t know what we don’t know. If we cannot express what we know in numbers, we don’t know much about it. If we don’t know much about it, we cannot control it. If we cannot control it, we are at the mercy of chance.” – Mikel Harry
“If we cannot express what we know in terms of numbers then our knowledge is of a meager and unsatisfactory kind.” – Lord Kelvin
Variation exists in everything. However,
"A fault in the interpretation of observations, seen everywhere, is to suppose that every event (defect, mistake, accident) is attributable to someone (usually the nearest at hand), or is related to some special event. The fact is that most troubles with service and production lie in the system. Sometimes the fault is indeed local, attributable to someone on the job or not on the job when he should be. We speak of faults of the system as common causes of trouble, and faults from fleeting events as special causes." - W. Edwards Deming
To be competitive we must remember that statistical techniques have played an important role in maintaining competitive position for the manufacturing industry. In order to maintain a competitive position, companies must manufacture products with almost perfect consistency and repeatability. This requires an ability to measure the variability of highly complex manufacturing processes. Capturing, characterizing, and analyzing the data on a repetitive basis will enable companies to maintain control the product, process, and system.
There are a couple of methods in which we evaluate the data on a recurring basis. The first is using an MSA / MSE which may be performed semi-annually or annually and the other is Statistical Process Control (SPC) / Numerical Evaluation of Metrics (NEM) to be performed on a recurring basis, depending on product volume. We will discuss the application of these processes individually starting with the Measurement System Analysis. We will discuss the Statistical Process Control or Numerical Evaluation of Metrics in our next article.
Objectives of a Measurement System
- Understand the data required and analysis techniques of MSA
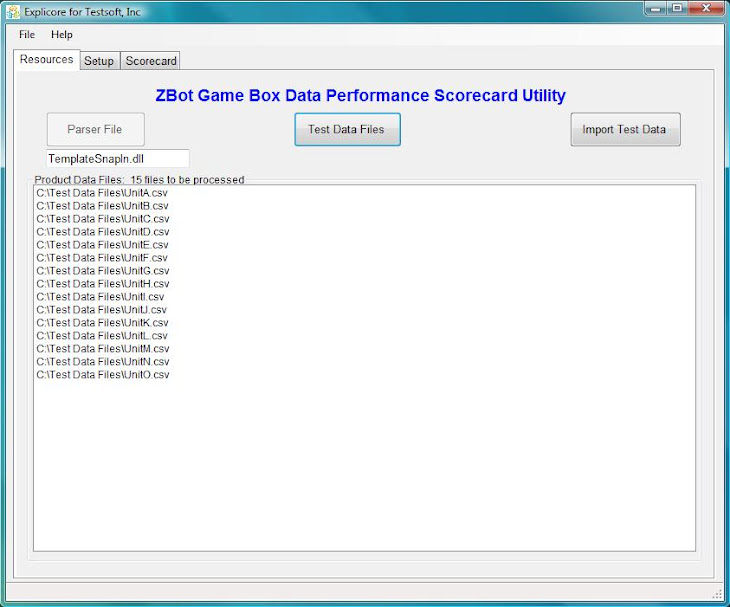
- Use Explicore, TestSoft’s Lean Six Sigma Tool (Data Analysis Scorecard Utility), to quickly identify the significantly few parameters in need of correction or improvement.
- Review Control Chart Methods and Data.
- Understand Common and Special Cause Variation (including the application of Western Electric Rules).
- Understand How to Use Information on the Variation Attributable to the Measurement System.
We can use an MSA which is a specially designed experiment that seeks to identify the components of variation in the measurement. Just as processes that produce a product may vary, the process of obtaining measurements and data may have variation and produce defects. An MSA evaluates the test method, measuring instruments, and the entire process of obtaining measurements to ensure the integrity of data used for analysis (usually quality analysis) and to understand the implications of measurement error for decisions made about a product or process. MSA is an important element of Six Sigma methodology and of other quality management systems. MSA analyzes the collection of equipment, operations, procedures, software and personnel that affects the assignment of a number to a measurement characteristic. Processing the data through TestSoft’s product, Explicore, will save valuable resource time and money to capture, characterize, and perform the initial analysis of the data.
An MSA considers the following:
- Select the correct measurement and approach.
- Assess the measuring device.
- Assess procedures & operators.
- Assess any measurement interactions.
- Calculate the measurement uncertainty of individual measurement devices and/or measurement systems.
- MSA identifies and quantifies the different sources of variation that affect a measurement system.
- Measurement Error: Variation in measurements can be attributed to variation in the item being measured or to the measurement system itself.
- The variation in the measurement system itself is measurement error.
MSA Elements
- The objective of an MSA/MSE is to learn as much as possible about the measurement process in a short amount of time (e.g., potential study).
- The strategy is to include equipment, operators, parts, etc. that will usually be elements of the measurement process.
- A random selection of parts representing inherent process variation from production should be made.
- The parts should be labeled in a way to record measurements and remove possible operator bias (blind marking).
- Each part will then be measured multiple times (at least twice) by each operator using the same equipment. This can be for each set of equipment.
Measurements may be influenced by the equipment used to make them or may be influenced by the process of making the measurements. The Measurement System includes the equipment and the process used in making the measurements.
As part of ISO9000:2008, the MSA is defined as an experimental and mathematical method of determining how much the variation within the measurement process contributes to overall process variability. There are five parameters to investigate in an MSA: bias, linearity, stability, repeatability and reproducibility. A general rule for measurement system acceptability is: Under 10 percent error is acceptable; 10 percent to 30 percent error suggests that the system is acceptable depending on the importance of application, cost of measurement device, cost of repair, and other factors; and over 30 percent error is considered unacceptable, and you should improve the measurement system.
Also, we need to understand the Western Electric Rules when reviewing the graphical data. In Statistical Process Control, the Western Electric Rules are decision rules for detecting "out-of-control" or non-random conditions on control charts. Locations of the observations relative to the control chart control limits (typically at ±3 standard deviations) and centerline indicate whether the process in question should be investigated for assignable causes. Their purpose was to ensure that line workers and engineers interpret control charts in a uniform way.
In addition to percent error and the Western Electric Rules, you should also review graphical analysis over time to decide on the acceptability of a measurement system.
Basic Parameters of the MSA
Any measurement process for a system typically involves measurement precision as well as measurement accuracy of the system variables subject to the constraints of the system. Requirement for statistically analyzing a system would involve a process to determine the variations from the mean (central) location which is imperative to analyze the measurement accuracy taking into consideration factors of bias, stability and linearity.
The parameters of MSA can be described as follows:
Bias refers to a probability of presence of certain factors in a system which can influence deviation from the standards in the system. Bias can lead to sampling of a data which on analysis appear to be different from the actual or anticipated data set. In order to measure the process measurement bias, for determinate measurement a process called calibration is needed which is of higher level than measuring the data average. In case of indeterminate measurement process owing to constraints, normally the data average values are compared with the standard values. In other words the Bias Effects is an average of measurements that are different by a fixed amount. Bias effects include:
- Operator bias - different operators get detectably different averages for the same thing.
- Machine bias - different machines get detectably different averages for the same thing, etc.
- Others - day to day (environment), fixtures, customer and supplier (sites).
Stability refers to processes which are normally free from special cause variations. Analyzing a system for stability typical involve the standard statistical processes such as SPC (Statistical Process Control), scatter plots, ANOVA techniques and other standard deviation measurement tools. Determination of stability standards in a system requires data sampled to cover a wide range of possible variation factors and intensive piece meal statistical tests covering variations in human resources, tools, parts, time, space and location factors.
Linearity refers to different statistical results from measurements when subjected to different metric spaces. Linearity in a system is determined using higher levels of calibrations in measurement standards which often guided by inferences drawn from various interaction factors influencing a system. For instance, a non linearity in a system may result from equipment (or tools) not calibrated for various levels of operating range or poor design of system or any other system constraint.
Discrimination is the ability of the measurement system to adequately differentiate between values of a measured parameter.
Accuracy or instrument accuracy is the difference between the observed average value of measurements and the master value. The master value is an accepted, traceable reference standard (e.g., NIST).
Variable Measurement Systems: Repeatability, Reproducibility
For measurement systems that result in quantitative measurements such as weight, concentration, or strength, it is important to determine the magnitude of any error in the resulting measurements. If the error is large, it may be impossible to determine whether or not an individual sample is within spec. In addition, designed experiments rely on the ability to separate real effects of making changes from the background noise and could be sabotaged by an inadequate measurement system.
When quantifying measurement error, it is common to separate the error:
- Repeatability (or measurement precision – the error due to the instrument or measurement procedure) and
- Reproducibility (the difference in the average of the measurements made by different persons using the same or different instrument when measuring the identical characteristic).
Attribute Measurement Systems
When the results of a measurement system are PASS or FAIL rather than a quantitative value, special procedures are necessary. There are three procedures to deal with such systems: risk analysis method, signal theory method, and analytic method. In the risk analysis method, multiple appraisers measure samples with known characteristics. Statistics are calculated based on how often the appraisers correctly characterize each sample and how frequently they agree with themselves and each other.
Assessing a Measurement Error
This can be evaluated by comparing the width of the control limits (average chart) with the spread of the plotted points (product variation).
- If all of the points fall within the control limits of the average chart, the measurement variation will over-shadow any product variation. Thus, any improvements to the production process may be undetectable due to extreme measurement error.
- If less than half of the average points are outside of the control limits, the measurement system may be inadequate for detecting product variation.
- If less than one fourth of the average points are inside the control limits, the measurement system is capable of assessing product parameters.
- Pick the measurement system to be evaluated
- Map the process
- Conduct data collection rigorously and use Explicore to quickly identify where to put resources to fix problem areas
- Think about the measurement process when drawing conclusions from the MSA/MSE using TestSoft’s product, Explicore. Remember, Explicore identifies the problems quickly up-front and gives a company the ability to correct problems before they become very costly to fix.
- Pay attention to the likely cause of measurement variation
- Implement the countermeasures
- Hold the gains: Control and improve the Measurement System
- Continually capture, characterize, and analyze the Product, Process, and System health to ensure the gains remain in control. The frequency of the evaluation depends on product volume.